
 568k
568k  233k
233k  41k
41k  Subscribe

By Dr. Jeff Masters
September 2017 was the planet’s fourth warmest September since record keeping began in 1880, said the National Oceanic and Atmospheric Administration’s (NOAA) National Centers for Environmental Information (NCEI) and NASA this week. The only warmer Septembers came during 2015, 2016 and 2014. Minor differences can occur between the NASA and NOAA rankings because of their different techniques for analyzing data-sparse regions such as the Arctic.
Global ocean temperatures last month were the fourth warmest on record for any September, according to NOAA, and global land temperatures were the third warmest on record. Global satellite-measured temperatures for the lowest 8 km of the atmosphere were the warmest for any September in the 39-year record, according to the University of Alabama Huntsville (UAH) and Remote Sensing Systems (RSS).

(Above) Departure of temperature from average for September 2017, the fourth warmest September for the globe since record keeping began in 1880. Record warmth was observed across parts of central and southern Africa, southern Asia and scattered across the western, northern, and southern Pacific Ocean, the Atlantic Ocean (off the southeastern coast of South America), the Norwegian Sea, Greenland Sea and Barents Sea, and across parts of the Indian Ocean. No land or ocean areas experienced record cold September temperatures. Photo credit: National Centers for Environmental Information (NCEI).
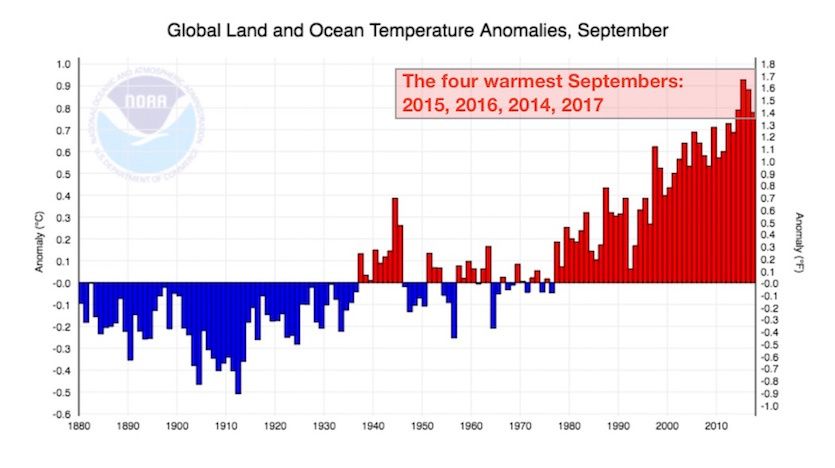
(Above) Departures from the 20th-century global average temperature for September, 1880-2017. The four warmest Septembers on record have all occurred in the last four years. Photo credit: NOAA / NCEI
Second-Warmest Year on Record Thus Far
Each of the first eight months of 2017 have ranked among the top four warmest such months on record, giving 2017 the second highest January–September temperature in the 138-year record: 0.78°C (1.57°F) above the 20th-century average. This is behind the record year of 2016 by 0.13°C (0.24°F). This near-record warmth in 2017 is especially remarkable given the lack of an El Niño event this year. Global temperatures tend to be warmer during El Niño years, when the ocean releases more heat to the atmosphere. Given the lack of an El Niño event in 2017, it is unlikely that we will surpass 2016 as the warmest year on record. However, 2017 is almost certain to be the planet’s warmest year on record that lacks any influence from El Niño, and Earth’s four warmest years of the last century-plus are likely to be 2016, 2017, 2015 and 2014.
Two Billion-Dollar Weather Disasters in September 2017
Two Category 5 Atlantic hurricanes caused billion-dollar weather disasters last month, according to the September 2017 Catastrophe Report from insurance broker Aon Benfield: Hurricane Irma and Hurricane Maria. Through the end of September, Earth had 21 billion-dollar weather events for the year, which is a typical number for this point in the year. The year that ended with the most billion-dollar weather disasters in records going back to 1990 was 2013, with 41; that year had 33 billion-dollar disasters by the end of September. Last year, there were 28 billion-dollar weather disasters by the end of September; that year ended up with 31 such disasters. Here are this year’s billion-dollar weather disasters through the end of September:
- Hurricane Harvey, U.S., 8/25 – 9/2, >$20 billion, 60 killed
- Hurricane Irma, Caribbean, Bahamas, SE U.S., 9/5 – 9/12, >$30 billion, 124 killed
- Hurricane Maria, Caribbean, 9/18 – 9/21, >$20 billion, 78 killed
- Flooding, China, 6/22 – 7/5, $7.5 billion, 141 killed
- Flooding, China, 7/13 – 7/17, $4.5 billion, 20 killed
- Typhoon Hato, Macau, Hong Kong, China, 8/23 – 8/24, $3.5 billion, 22 killed
- Flooding, Peru, 1/1 – 4/1, $3.1 billion, 120 killed
- Severe Weather, Rockies, Plains, U.S., 5/8 – 5/11, $2.6 billion, 0 killed
- Drought, China, 5/1 – 8/31, $2.5 billion, 0 killed
- Tropical Cyclone Debbie, Australia, 3/27 – 4/5, $2.4 billion, 14 killed
- Drought, Italy, 1/1 – 7/31, $2.3 billion, 0 killed
- Severe Weather, Plains, Southeast, Midwest U.S., 3/26 – 3/28, $2.3 billion, 0 killed
- Severe Weather, Midwest, Plains, Southeast U.S., 3/6 – 3/10, $2.1 billion, 0 killed
- Severe Weather, Midwest, Plains, Southeast MS Valley U.S., 4/28 – 5/01, $2.0 billion, 20 killed
- Drought, Somalia, Ethiopia, Kenya, 1/1 – 3/31, $1.9 billion, hundreds killed
- Severe Weather, South U.S., 2/27 – 3/2, $1.9 billion, 4 killed
- Severe Weather, Midwest U.S., 6/11, $1.8 billion, 0 killed
- Severe Weather, South U.S., 1/18 – 1/23, $1.3 billion, 21 killed
- Tropical Storm Nanmadol, Japan, 7/4 – 7/6, $1.0 billion, 37 killed
- Severe Weather, Plains, Midwest, Northeast U.S., 6/27 – 6/30, $1.0 billion, 0 killed
- Winter Weather, Plains, Midwest, Southeast, Northeast U.S., 3/13 – 3/15, $1.0 billion, 11 killed
55 – 65 Percent Chance of La Niña by Winter
In its October 12 monthly advisory, NOAA’s Climate Prediction Center (CPC) stated that neither El Niño nor La Niña conditions were present in the Eastern Pacific (ENSO-neutral conditions existed). Sea surface temperatures (SSTs) in the benchmark Niño 3.4 region (in the equatorial Pacific) were about 0.5°C below average over the past week; SSTs of 0.5°C or more below average in this region are required to be classified as weak La Niña conditions, with the 3-month average SSTs holding at these levels for five consecutive months (with an accompanying La Niña-like atmospheric response). Enhanced east-to-west blowing trade winds are predicted for the west-central Pacific over the next two weeks and these stronger-than-average trade winds will help the progression towards La Niña. NOAA forecasters gave a 55 – 65 percent chance of a La Niña event by winter, similar to the 55 – 60 percent odds given in their previous month’s forecast.

(Above) Sea surface temperatures (SSTs) in the benchmark Niño 3.4 region (in the equatorial Pacific) were oscillating around 0.5°C below average for the first half of October, near the 0.5°C below average threshold for weak La Niña conditions. Photo credit: Levi Cowan, tropicaltidbits.com.
Arctic Sea Ice Extent the Seventh Lowest on Record for September
Arctic sea ice extent during September 2017 was the seventh lowest in the 38-year satellite record, according to the National Snow and Ice Data Center (NSIDC). The Arctic was dominated by low pressure and clouds in the summer of 2017. The cyclonic (counterclockwise) winds associated with the stormy pattern also tend to spread out the sea ice. Together, this two influences brought slower ice loss than in the record-low extent years of 2012 and 2007. The Arctic reached its lowest extent for the year on Sept. 13, which was the eighth lowest extent on record. The five lowest Arctic sea ice extents were measured in September 2012, 2007, 2016, 2011 and 2015.
Antarctic Sea Ice Extent the Second Lowest on Record for September
Sea ice surrounding Antarctica had the second lowest extent on record in September 2017 and has been at record- to near-record lows since September 2016. A recent study by John Turner and colleagues links the recent Antarctic sea ice decline to a series of strong storms accompanied by long periods of warm winds from the north. These changing weather conditions are associated with large shifts in the Southern Annual Mode (SAM) index.
Notable Global Heat and Cold Marks Set for September 2017
- Hottest temperature in the Northern Hemisphere: 50.3°C (122.5°F) at Mitribah, Kuwait, Sept. 3
- Coldest temperature in the Northern Hemisphere: -37.0°C (-27.2°F) at Summit, Greenland, Sept. 3
- Hottest temperature in the Southern Hemisphere: 42.8°C (109.0°F) at Birdsville, Australia, Sept. 27
- Coldest temperature in the Southern Hemisphere: -78.3°C (-108.9°F) at Concordia, Antarctica, Sept. 2
(Courtesy of Maximiliano Herrera.)
Major Weather Stations That Set (Not Tied) New All-Time Heat or Cold Records in September 2017
So far in 2017, 168 major weather stations have set records for the all-time highest temperature ever measured and 17 have set records for the all-time lowest temperature ever measured. Here are the records for September 2017:
- San Francisco (California) max. 41.1°C, Sep. 1
- Salinas (California) max. 42.8°C, Sept. 2
- Palo Alto (California) max. 42.2°C, Sept. 2
- San Luis Obispo (California) max. 46.1°C, Sept. 2
- King City (California) max. 46.1°C, Sept. 2
- Santa Cruz (California) max. 43.3°C, Sept. 2
- Conceicao do Araguaia (Brazil) max. 41.5°C, Sept. 19
(Courtesy of Maximiliano Herrera.)
No All-Time National Heat Records Set or Tied in September 2017
No all-time national heat records were set or tied in September 2017. As of October 17, thirteen nations have set or tied all-time national heat records in 2017 and two have set or tied all-time cold records. National all-time monthly temperature records so far in 2017 have numbered 44 for maximum temperature and two for minimum temperature. Most nations do not maintain official databases of extreme temperature records, so the national temperature records reported here are in many cases not official. I use as my source for international weather records researcher Maximiliano Herrera, one of the world’s top climatologists, who maintains a comprehensive list of extreme temperature records for every nation in the world on his website. If you reproduce this list of extremes, please cite Maximiliano Herrera as the primary source of the weather records.
All-Time National Heat Records Set or Tied in 2017:
- Macau: 102.2°F (39.0°C) at Ka Ho, Coloane Island, Aug. 22 (tie)
- Hong Kong: 102.2°F (39.0°C) at Wetland Park, Aug. 22
- San Marino: 104.5°F (40.3°C), at Serravalle, Aug. 3 and 9
- Vatican City: 105.3°F (40.7°C) at Roma Macao AWS, Aug. 2 (tie)
- United Arab Emirates: 125.2°F (51.8°C), at Mezaira, July 30
- Spain: 117.1°F (47.3°C), at Montoro AEMET, July 13
- Iran: 128.7°F (53.7°C), at Ahwaz, June 29
- Oman: 123.4°F (50.8°C), at Qurayyat on May 30 and at Joba on May 31 (tie)
- Pakistan: 128.3°F (53.5°C), at Turbat on May 28 (tie)
- Guinea: 113°F (45.0°C), at Koundara, March 29 (tie)
- Ghana: 110.8°F (43.8°C), at Navrongo, March 26
- Chile: 113°F (45.0°C), at Cauquenes, Jan. 26
- Cocos Islands (Australia): 91.0°F (32.8°C), at Cocos Island Airport, Feb. 23 (tie with April 8, 2015 and April 11, 1998)
All-Time National Cold Records Set in 2017:
- United Arab Emirates: 22.3°F (-5.4°C) at Jabel Jais, Feb. 3
- Qatar: 34.7°F (1.5°C) at Abu Samra, Feb. 5
National Monthly Maximum Temperature Records Tied or Beaten in 2017 (44):
- Jan: Comoros, Uganda, Singapore, Mexico
- Feb: Iceland
- Mar: Kenya, Indonesia, Spain, Chile, Cook Islands
- Apr: Ghana, Wallis and Futuna, Honduras, Samoa, Uganda, Pakistan, Cabo Verde, UAE
- May: Greece, Iran, Norway, Austria
- June: Mexico, Oman, Iraq, Turkey, Albania, Portugal, UAE
- July: Cyprus, Comoros, Mayotte, Saudi Arabia, Indonesia, Niger
- August: Iran, UAE, Trinidad and Tobago, U.S., French Guiana
- September: Syria, Saudi Arabia, Iceland
- October: Portugal
National Monthly Minimum Temperature Records Set in 2017 (2):
- Jan: St. Eustatius
- July: Greenland
Other Records Set in 2017:
- World record of highest minimum temperature for March: 35.6°C at Yelimane, Mali, March 31
- Asian record of highest temperature ever recorded in April: 50.0°C at Larkana, Pakistan, April 19
- World record of highest temperature ever recorded in May (tied): 53.5°C at Turbat, Pakistan, May 28
- Asian record of highest temperature ever recorded in June: 53.7°C at Ahwaz, Iran, June 29
- Northern Hemisphere record of lowest temperature ever recorded in July: -33.0°C at Summit, Greenland, July 4
Reposted with permission from our media associate Weather Underground.